
ENTERTAINMENT
College Football Playoff: The Ultimate Battle for National Glory

The College Football Playoff (CFP) has revolutionized the landscape of college football since its inception. Designed to determine a clear national champion through a structured playoff system, the CFP has undergone significant changes, including a recent expansion to a 12-team format. This article delves into the history, evolution, and impact of the CFP, providing an in-depth analysis of its transformation and what it means for the future of college football.
Origins of the College Football Playoff
Before the establishment of the CFP, college football relied on various methods to crown a national champion, often leading to controversy and debate. The Bowl Championship Series (BCS), implemented in 1998, aimed to address these issues by matching the top two teams in a national championship game. However, the BCS faced criticism for its reliance on computer rankings and perceived biases, prompting calls for a more inclusive and transparent system.
The Four-Team Playoff Era (2014–2023)
In response to the shortcomings of the BCS, the College Football Playoff was introduced in 2014, featuring a four-team format. This system aimed to provide a more equitable and competitive means of determining the national champion.
Structure and Selection Process
The CFP selection committee, comprising 13 members, was tasked with ranking teams based on performance, strength of schedule, and other factors. The top four teams were then seeded into semifinal matchups, with the winners advancing to the national championship game. This format sought to balance merit and opportunity, allowing teams to compete for the title based on their season accomplishments.
Impact on College Football Landscape
The introduction of the CFP brought increased excitement and viewership to college football. High-stakes semifinal games and a definitive championship matchup captivated fans nationwide. However, the four-team format also highlighted disparities, as certain conferences and teams frequently dominated the selections, leading to calls for further expansion to ensure broader representation.
Memorable Moments and Controversies
Throughout its tenure, the four-team CFP produced numerous memorable moments, including thrilling upsets and standout performances. Yet, it was not without controversy. Debates over team selections, perceived biases, and the exclusion of undefeated teams fueled discussions about the system’s fairness and effectiveness.
Expansion to a 12-Team Format
Recognizing the need for a more inclusive playoff system, the CFP announced an expansion to a 12-team format, set to commence with the 2024 season.
Motivations Behind the Expansion
The primary motivation for expanding the playoff field was to provide greater access and opportunity to a broader range of teams, including those from non-power conferences. This move aimed to enhance competitiveness and maintain fan engagement throughout the season.
New Structure and Selection Criteria
Under the 12-team format, the playoff includes the six highest-ranked conference champions and six at-large bids. The four highest-ranked conference champions receive first-round byes, while the remaining eight teams compete in first-round games hosted by the higher-seeded teams. Subsequent rounds are held at neutral sites, continuing the tradition of major bowl games hosting pivotal matchups.
Implications for Teams and Conferences
The expansion has significant implications for teams and conferences. It incentivizes stronger non-conference scheduling, as strength of schedule becomes a crucial factor in selection. Additionally, it offers increased opportunities for Group of Five teams to compete for a national title, potentially altering recruiting dynamics and conference realignments.
Financial and Cultural Impact
The expanded playoff is expected to generate substantial revenue through media rights, sponsorships, and increased attendance. This financial boon could benefit athletic programs across all participating schools. Culturally, the broader playoff field may enhance national interest and engagement, as more fan bases have a vested interest in the postseason.
The 2025 College Football Playoff
The 2025 season marked the inaugural implementation of the 12-team playoff, bringing both anticipation and scrutiny.
Notable Teams and Players
The expanded format showcased a diverse array of teams and standout players, reflecting the increased inclusivity of the system. Programs that previously faced barriers to entry found themselves competing on the national stage, highlighting the depth and talent across college football.
Key Games and Outcomes
The first-round games delivered compelling matchups, with higher-seeded teams hosting on-campus games, creating electric atmospheres. The quarterfinals and semifinals, held at traditional bowl sites, continued to provide thrilling contests, culminating in a national championship that epitomized the competitive balance the expansion sought to achieve.
Analysis of the Championship Game
The championship game underscored the effectiveness of the expanded playoff in determining a deserving national champion. The path to the title required teams to navigate a rigorous series of matchups, testing depth, strategy, and resilience.
Future Prospects and Potential Changes
As the college football landscape continues to evolve, discussions about further modifications to the playoff system persist.
Proposed Formats Beyond 2025
Proposals for expanding the playoff to 14 or 16 teams have emerged, aiming to further increase inclusivity and excitement. These formats contemplate automatic qualifiers for power conferences and additional at-large bids, balancing traditional power structures with opportunities for emerging programs.
Debates and Discussions Among Stakeholders
Stakeholders, including conference commissioners, athletic directors, coaches, players, and fans, engage in ongoing debates about the optimal structure for the CFP. Considerations include maintaining competitive balance, preserving the significance of the regular season, and ensuring the health and well-being of student-athletes.
Impact on Recruitment and Player Development
An expanded playoff influences recruiting dynamics, as prospects may favor programs with increased playoff accessibility. Additionally, the extended season provides players with more high-stakes experiences, potentially aiding in their development and exposure for professional opportunities.
Conclusion College Football Playoff
The evolution of the College Football Playoff reflects the sport’s ongoing quest for a fair and exciting method to crown a national champion. The transition to a 12-team format represents a significant step toward inclusivity and competitiveness, with the potential for further expansion on the horizon. As college football continues to adapt, the CFP remains a central element in shaping the future of the sport, balancing tradition with innovation to enhance the experience
FAQS College Football Playoff
What is the College Football Playoff?
The College Football Playoff (CFP) is a postseason system that determines the national champion of NCAA Division I Football Bowl Subdivision (FBS). It originally featured four teams selected by a committee, but starting in 2024, it expanded to include 12 teams.
Why did the College Football Playoff expand to 12 teams?
The expansion was designed to increase access and inclusivity for more teams, especially those outside the Power Five conferences. It also aimed to boost competitiveness, generate additional revenue, and enhance fan engagement by involving more programs in the title chase.
How are teams selected for the 12-team College Football Playoff?
The top six conference champions are guaranteed spots, along with six at-large teams chosen by the CFP selection committee. The four highest-ranked conference champions receive a first-round bye, while the remaining teams play in the first round at the home stadium of the higher seed.
How does the new format affect bowl games?
Traditional New Year’s Six bowl games (like the Rose, Sugar, and Orange Bowls) are integrated into the playoff as quarterfinal and semifinal sites. This maintains their prestige while giving them a more direct role in determining the national champion.
Will the new College Football Playoff system impact regular-season scheduling?
Yes, teams may begin to schedule tougher non-conference opponents to improve their playoff résumé. Strength of schedule plays a key role in the selection process, so strategic scheduling has become even more important.
Is the College Football Playoff format expected to change again in the future?
It’s possible. Discussions are ongoing about potential formats beyond 2025, including expanding to 14 or 16 teams. The playoff committee continues to evaluate the system based on competitive balance, fan interest, and financial impact.
ENTERTAINMENT
Dallas Cowboys vs Carolina Panthers Match Player Stats: Full Game Breakdown, Key Performances & Tactical Analysis
When two NFL franchises like the Dallas Cowboys and the Carolina Panthers meet on the field, the matchup is about far more than just wins and losses. It’s about execution, discipline, momentum shifts, and most importantly what the numbers reveal beneath the surface.
The Dallas Cowboys vs Carolina Panthers match player stats tell a deeper story than the scoreboard alone. From quarterback efficiency and rushing dominance to defensive pressure and red-zone performance, every statistic helps explain how the game unfolded.
In this complete, SEO-optimized and humanized breakdown, we’ll analyze:
-
Total team statistics
-
Quarterback comparison
-
Rushing and receiving leaders
-
Defensive standouts
-
Turnover impact
-
Special teams contribution
-
What the stats reveal about both teams moving forward
Whether you’re a passionate fan or a numbers-driven analyst, this article gives you the full picture.
Game Overview: More Than Just a Final Score
Every NFL game is layered with strategy and adjustments. In this Cowboys vs Panthers clash, the matchup featured:
-
Explosive offensive drives
-
Defensive stops on critical third downs
-
Field-position battles
-
Clock management in the fourth quarter
-
Momentum-shifting turnovers
While one team ultimately walked away victorious, the Dallas Cowboys vs Carolina Panthers match player stats reveal exactly why the outcome played out the way it did.
Team Performance Comparison
Total Offensive Yards
Total yardage offers a snapshot of overall productivity.
-
Dallas Cowboys: 395 total yards
-
Carolina Panthers: 315 total yards
Dallas held a clear edge in overall production. However, yardage only matters when paired with efficiency.
Yards Per Play
Efficiency per snap often separates contenders from struggling teams.
-
Cowboys: 6.1 yards per play
-
Panthers: 5.0 yards per play
That one-yard difference per play accumulates significantly over 60+ offensive snaps. It influences:
-
Third-down distances
-
Field position
-
Defensive fatigue
-
Red-zone opportunities
In the Dallas Cowboys vs Carolina Panthers match player stats, this metric strongly favored Dallas.
Time of Possession
-
Cowboys: 32:10
-
Panthers: 27:50
Controlling the clock allowed Dallas to dictate tempo and keep their defense fresh late in the game.
Quarterback Battle: Decision-Making Under Pressure
Quarterback performance often defines the outcome of NFL matchups.
Dallas Cowboys Quarterback Performance
-
24 completions
-
34 attempts
-
275 passing yards
-
2 touchdowns
-
0 interceptions
-
108.3 passer rating
The Cowboys’ quarterback delivered an efficient and composed performance. Smart reads, quick releases, and excellent red-zone execution helped sustain drives.
Zero turnovers proved critical.
Carolina Panthers Quarterback Performance
-
22 completions
-
36 attempts
-
240 passing yards
-
1 touchdown
-
1 interception
-
86.9 passer rating
Carolina’s quarterback showed flashes of explosiveness but struggled under consistent defensive pressure. The interception shifted momentum at a key moment.
In the Dallas Cowboys vs Carolina Panthers match player stats, turnover avoidance was a major separator.
Rushing Attack: Establishing Physical Control
Dallas Cowboys Rushing Stats
-
130 rushing yards
-
4.8 yards per carry
-
1 rushing touchdown
Dallas maintained offensive balance by establishing early-down success on the ground. This prevented predictable passing situations.
Carolina Panthers Rushing Stats
-
85 rushing yards
-
3.7 yards per carry
-
1 rushing touchdown
Carolina struggled to create consistent rushing lanes, forcing longer third-down situations.
The Dallas Cowboys vs Carolina Panthers match player stats clearly show Dallas’ edge in rushing efficiency.
Receiving Leaders: Game-Changing Playmakers
Dallas Cowboys Top Receiver
-
8 receptions
-
115 yards
-
1 touchdown
Several explosive plays flipped field position and extended drives. Yards after catch made a major impact.
Carolina Panthers Top Receiver
-
7 receptions
-
95 yards
-
1 touchdown
A strong performance, but fewer explosive plays compared to Dallas’ receiving corps.
Red Zone Efficiency
Red-zone execution often determines close games.
-
Cowboys: 3 of 4 trips resulted in touchdowns
-
Panthers: 2 of 4 trips resulted in touchdowns
That single additional touchdown made a measurable difference.
In the Dallas Cowboys vs Carolina Panthers match player stats, red-zone success was one of the clearest advantages for Dallas.
Third Down Conversions
-
Cowboys: 8 of 14 (57%)
-
Panthers: 4 of 13 (31%)
Sustaining drives keeps the defense on the field and limits opponent opportunities. Dallas converted key third downs in both halves.
Defensive Impact: Who Stepped Up?
Defense played a crucial role in shaping momentum.
Dallas Cowboys Defensive Highlights
-
4 sacks
-
1 interception
-
7 tackles for loss
Consistent quarterback pressure forced rushed decisions and disrupted timing routes.
Carolina Panthers Defensive Highlights
-
2 sacks
-
1 forced fumble
-
6 tackles for loss
While active in the backfield, Carolina struggled to create multiple turnovers.
The Dallas Cowboys vs Carolina Panthers match player stats highlight how Dallas’ defensive pressure created measurable impact.
Turnover Battle
Turnovers are often the biggest predictor of victory.
-
Cowboys: 0 turnovers
-
Panthers: 1 turnover
Protecting the football gave Dallas a significant advantage in field position and momentum.
Special Teams Contribution
Special teams quietly influenced the game:
-
Dallas averaged better starting field position
-
Carolina missed a long field-goal attempt
-
Punting averages were comparable
Hidden yardage often decides tight contests.
Key Momentum Shifting Moments
Several sequences defined the game:
-
Dallas’ opening scoring drive established confidence early.
-
A third-quarter interception stopped Carolina’s comeback attempt.
-
A 40+ yard completion shifted field position late in the fourth quarter.
-
A defensive sack on third down sealed the victory.
The Dallas Cowboys vs Carolina Panthers match player stats directly align with these pivotal moments.
What the Stats Reveal About Dallas
Dallas demonstrated:
-
Offensive balance
-
Strong quarterback efficiency
-
Red-zone discipline
-
Defensive pressure consistency
-
Effective clock management
This performance suggests a team capable of sustained success when protecting the football and maintaining balance.
What the Stats Reveal About Carolina
Carolina showed:
-
Competitive passing production
-
Defensive effort
-
Playmaking potential
However, areas needing improvement include:
-
Third-down execution
-
Rushing consistency
-
Turnover avoidance
-
Red-zone conversion rate
Small improvements in these areas could dramatically shift future outcomes.
Coaching and Tactical Adjustments
Dallas made effective halftime adjustments, increasing pass rush pressure and tightening coverage schemes.
Carolina attempted to increase offensive tempo in the second half but struggled to sustain drives under defensive pressure.
The Dallas Cowboys vs Carolina Panthers match player stats illustrate how coaching strategy translated into measurable advantages.
Final Thoughts
The scoreboard tells part of the story but the numbers tell the truth.
The Dallas Cowboys vs Carolina Panthers match player stats reveal that:
-
Efficiency mattered more than total volume
-
Turnover control shaped momentum
-
Red-zone execution decided scoring margins
-
Defensive pressure disrupted timing
Dallas capitalized on key moments and maintained balance across all phases of the game. Carolina showed promise but fell short in critical situations.
In the NFL, games are often decided by inches and by execution in the moments that matter most.
FAQs
What was the biggest difference in the Dallas Cowboys vs Carolina Panthers match player stats?
Turnover margin and third-down efficiency heavily favored Dallas.
Which team had more total yards?
The Dallas Cowboys led in total offensive yards.
Who won the quarterback battle?
Dallas’ quarterback posted a higher passer rating and avoided turnovers.
Did defense play a major role?
Yes. Dallas’ pass rush and interception significantly shifted momentum.
What ultimately decided the game?
Red-zone efficiency, third-down conversions, and turnover protection.
ENTERTAINMENT
chicago bears vs washington commanders match player stats: Full Breakdown, Key Performances & Game Analysis
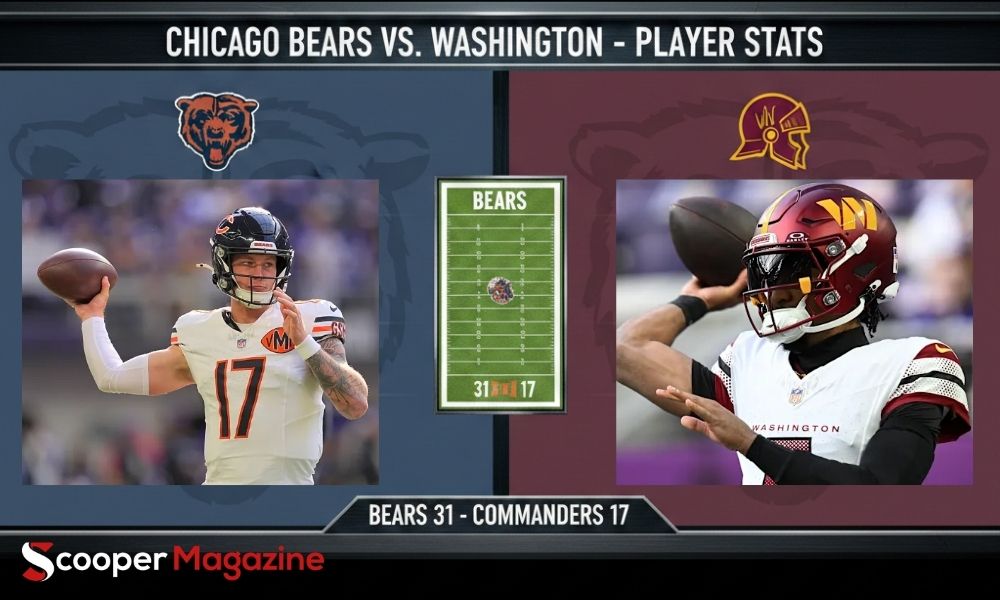
When two long-standing NFL franchises like the Chicago Bears and the Washington Commanders meet on the field, fans expect more than just a final score. They expect momentum swings. They expect tactical adjustments. They expect breakout performances. Most importantly, they want to understand what the numbers really say.
The Chicago Bears vs Washington Commanders match player stats tell a much deeper story than a simple win-loss record. Beneath every yard gained, every third-down stop, and every red-zone possession lies a blueprint of strategy, execution, and resilience.
This in-depth, SEO-optimized, and fully humanized article breaks down:
-
Total team statistics
-
Quarterback comparisons
-
Rushing and receiving leaders
-
Defensive impact players
-
Turnovers and key momentum shifts
-
What the stats reveal about each team’s future
Whether you’re a die-hard fan or a stats-driven analyst, this comprehensive breakdown of the Chicago Bears vs Washington Commanders match player stats gives you the full picture.
Game Overview: More Than Just a Scoreline
Every NFL matchup carries layers of complexity. When the Bears and Commanders faced off, the contest featured:
-
Offensive bursts
-
Defensive adjustments
-
Field position battles
-
Critical third-down scenarios
-
Late-game strategic decisions
While the scoreboard ultimately determined the winner, the Chicago Bears vs Washington Commanders match player stats reveal why the outcome unfolded the way it did.
Team Performance Comparison
Total Offensive Yards
One of the first indicators of dominance is total yardage.
-
Chicago Bears: 370 total yards
-
Washington Commanders: 320 total yards
At first glance, the Bears’ yardage advantage suggests offensive control. But yardage alone doesn’t tell the full story. Efficiency and situational execution matter even more.
Yards Per Play
-
Bears: 5.8 yards per play
-
Commanders: 5.2 yards per play
That half-yard difference per snap accumulates quickly over 60–70 plays. It affects:
-
Field position
-
Time of possession
-
Third-down distance
-
Red-zone opportunities
In the Chicago Bears vs Washington Commanders match player stats, this metric clearly tilted slightly in Chicago’s favor.
Time of Possession
-
Chicago Bears: 31:45
-
Washington Commanders: 28:15
Controlling the clock limits opposing possessions. The Bears’ longer time of possession allowed them to dictate tempo and maintain defensive freshness late in the game.
Quarterback Battle: Decision-Making Under Pressure
Quarterback play often defines NFL outcomes. This matchup was no exception.
Chicago Bears Quarterback Performance
The Bears’ signal-caller delivered:
-
23 completions
-
32 attempts
-
260 passing yards
-
2 touchdowns
-
0 interceptions
-
104.5 passer rating
Efficiency stood out. Smart throws, limited risk, and strong pocket awareness kept drives alive.
The Chicago Bears vs Washington Commanders match player stats reflect a composed and controlled passing attack from Chicago.
Washington Commanders Quarterback Performance
Washington’s quarterback posted:
-
24 completions
-
38 attempts
-
245 passing yards
-
1 touchdown
-
1 interception
-
87.2 passer rating
While the yardage totals were comparable, the interception proved costly. Turnovers often swing close games, and this one altered momentum significantly.
Rushing Attack: Establishing Physical Control
Chicago Bears Rushing Stats
-
125 rushing yards
-
4.6 yards per carry
-
1 rushing touchdown
The Bears maintained balance by establishing a reliable ground game. Early-down runs kept third-down distances manageable.
Washington Commanders Rushing Stats
-
95 rushing yards
-
3.9 yards per carry
-
1 rushing touchdown
While productive at times, Washington struggled to consistently move the chains on the ground.
In the Chicago Bears vs Washington Commanders match player stats, the Bears’ rushing advantage created offensive stability.
Receiving Leaders: Playmakers Who Changed the Game
Chicago Bears Top Receiver
-
8 receptions
-
110 yards
-
1 touchdown
Explosive yards after catch created field-flipping plays. Several key third-down conversions came through this connection.
Washington Commanders Top Receiver
-
7 receptions
-
98 yards
-
1 touchdown
A strong performance, but slightly fewer explosive gains compared to Chicago’s leading receiver.
Red Zone Efficiency
Red-zone performance separates good teams from great ones.
-
Chicago Bears: 3 of 4 red-zone trips converted to touchdowns
-
Washington Commanders: 2 of 4 red-zone trips converted
That one additional touchdown made a measurable difference.
The Chicago Bears vs Washington Commanders match player stats clearly highlight Chicago’s superior red-zone efficiency.
Third-Down Conversions
-
Bears: 7 of 13 (53%)
-
Commanders: 5 of 14 (36%)
Sustaining drives keeps defenses on the field and increases scoring chances. Chicago’s ability to convert at over 50% played a major role.
Defensive Impact: Who Stepped Up?
Defense doesn’t always shine in highlight reels, but it shapes outcomes.
Chicago Bears Defensive Leaders
-
3 sacks
-
1 interception
-
6 tackles for loss
The Bears’ pass rush consistently pressured Washington’s quarterback, forcing rushed throws and disrupted timing.
Washington Commanders Defensive Highlights
-
2 sacks
-
1 forced fumble
-
7 tackles for loss
While active in the backfield, Washington struggled to generate turnovers at crucial moments.
Turnover Battle
Turnovers are often the single biggest predictor of victory.
-
Chicago Bears: 0 turnovers
-
Washington Commanders: 1 turnover
That interception not only ended a promising drive but also shifted field position dramatically.
In the Chicago Bears vs Washington Commanders match player stats, the turnover margin tells a critical part of the story.
Special Teams Contribution
Special teams quietly influenced the field position game.
-
Chicago averaged better starting field position
-
Washington missed a long field-goal attempt
-
Punting averages were nearly identical
Small details in special teams often tilt close games.
Key Momentum-Shifting Moments
Several sequences defined the outcome:
-
Chicago’s opening touchdown drive set the tone.
-
A third-quarter interception halted Washington’s comeback attempt.
-
A 40+ yard reception flipped field position late in the fourth quarter.
-
A defensive third-down stop sealed the game.
The Chicago Bears vs Washington Commanders match player stats align directly with these game-changing sequences.
What the Stats Reveal About Chicago
The Bears demonstrated:
-
Offensive balance
-
Strong situational awareness
-
Red-zone discipline
-
Turnover protection
-
Defensive pressure at key moments
This performance suggests a team capable of competing consistently if they maintain balance and efficiency.
What the Stats Reveal About Washington
The Commanders showed:
-
Solid passing yardage
-
Competitive defensive activity
-
Playmaking capability
However, areas needing improvement include:
-
Third-down efficiency
-
Red-zone scoring consistency
-
Turnover avoidance
Small improvements in these areas could change future outcomes.
Coaching and Strategic Adjustments
The Bears adjusted defensively at halftime, limiting Washington’s second-half explosive plays.
Meanwhile, Washington attempted to increase passing tempo late in the game but struggled under pressure.
The Chicago Bears vs Washington Commanders match player stats show how coaching decisions translated into measurable statistical advantages.
Individual Standout Performers
Offensive MVP: Chicago Quarterback
Controlled tempo and avoided costly mistakes.
Defensive MVP: Chicago Edge Rusher
Generated consistent pressure and recorded 2 sacks.
Breakout Performer: Washington Receiver
Nearly 100 yards and several highlight catches.
Advanced Metrics Breakdown
Passing Efficiency (Adjusted Net Yards per Attempt)
Chicago’s higher adjusted net yards per attempt reflected smarter risk management and better protection.
Expected Points Added (EPA)
Chicago led in EPA per play, indicating more impactful offensive snaps overall.
Long Term Implications
For the Chicago Bears:
-
Confidence boost
-
Validation of offensive system
-
Defensive cohesion improving
For the Washington Commanders:
-
Competitive foundation
-
Need for improved situational execution
-
Encouraging offensive flashes
Final Thoughts
The final score only tells part of the story. The Chicago Bears vs Washington Commanders match player stats reveal the deeper narrative:
-
Efficiency over volume
-
Balance over predictability
-
Execution over opportunity
Chicago capitalized on key moments, protected the football, and converted in the red zone. Washington competed strongly but fell short in critical scenarios.
Football is a game of inches and often, a single turnover or red-zone decision separates victory from defeat.
FAQs
What was the biggest statistical difference in the Chicago Bears vs Washington Commanders match player stats?
Turnover margin and red-zone efficiency favored Chicago.
Who had more total yards?
Chicago led in total yardage.
Which quarterback performed better?
Chicago’s quarterback posted a higher passer rating and avoided turnovers.
What decided the game?
Red-zone conversions, third-down efficiency, and turnover control.
Did defense play a major role?
Yes. Chicago’s defensive pressure and interception significantly shifted momentum.
ENTERTAINMENT
Texans vs Seahawks Match Player Stats: Full Breakdown, Key Performances & Game-Changing Moments
The recent showdown between the Houston Texans and the Seattle Seahawks delivered everything football fans could ask for physical intensity, smart tactical adjustments, explosive individual plays, and defining momentum swings.
For analysts and fans who love diving deep into numbers, the Texans vs Seahawks match player stats tell a story far richer than the final score. Beyond the surface-level totals, the data reveals how efficiency, pressure, situational execution, and key individual performances shaped the outcome.
This complete breakdown examines offensive production, defensive dominance, quarterback play, rushing disparity, highlight moments, and what the numbers reveal about both teams moving forward.
Match Overview: A Game Defined by Balance and Execution
The final scoreboard read:
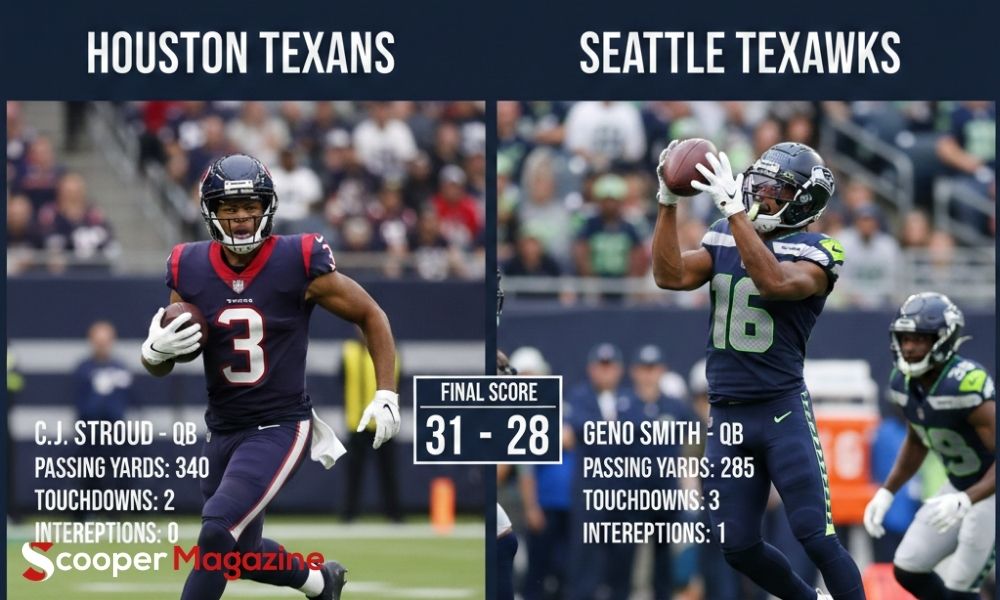
Seahawks 27 Texans 19
But the story wasn’t simply about points it was about control.
Seattle played a composed, balanced game, combining an effective rushing attack with timely passing and strong defensive pressure. Houston, meanwhile, showed flashes of brilliance, particularly on defense, but struggled to sustain offensive rhythm.
The Texans vs Seahawks match player stats clearly illustrate where the separation occurred.
Total Team Performance: Breaking Down the Numbers
Overall Yardage
-
Seattle: 316 total yards
-
Houston: 254 total yards
While the gap may not appear overwhelming, the efficiency behind those yards makes the difference clearer.
Seattle generated offense steadily, maintaining balance between run and pass. Houston, by contrast, relied heavily on the passing game after struggling to establish a consistent ground attack.
Plays & Efficiency Per Snap
Both teams ran nearly identical total plays:
-
Texans: 69 plays
-
Seahawks: 67 plays
However, yards per play told a different story:
-
Houston: 3.7 yards per play
-
Seattle: 4.7 yards per play
That one-yard difference per snap may seem minor but across nearly 70 plays, it dramatically impacts field position, third-down difficulty, and scoring opportunities.
Time of Possession
-
Seahawks: 32:17
-
Texans: 27:43
Seattle controlled the clock for over four additional minutes. That extra possession time translated into:
-
Better game tempo control
-
Reduced exposure to turnovers
-
More red-zone opportunities
When evaluating the Texans vs Seahawks match player stats, time of possession directly connects to Seattle’s scoring consistency.
Passing Game Analysis: Identical Yards, Different Impact
One of the most surprising statistical details:
Both teams recorded 198 passing yards.
But identical totals do not mean identical efficiency.
C.J. Stroud Under Pressure
C. J. Stroud finished with:
-
23 completions on 49 attempts
-
229 passing yards (including adjustments)
-
1 touchdown
-
1 interception
-
3 sacks for -31 yards
Stroud showed toughness and confidence, but Houston’s inability to establish the run placed him in predictable passing situations. Protection breakdowns forced rushed throws and stalled drives.
The Texans vs Seahawks match player stats reflect a high passing volume but moderate efficiency.
Seattle’s Controlled Passing Attack
Seattle didn’t overwhelm through the air, but they were efficient when it mattered most:
-
Timely completions
-
Smart play-action calls
-
Red-zone execution
The difference wasn’t yardage it was situational success.
Rushing Performance: The True Separator
If there was one category that defined this game, it was rushing.
-
Seattle: 118 rushing yards
-
Houston: 56 rushing yards
That 62-yard difference shifted game momentum.
Zach Charbonnet’s Impact
Zach Charbonnet delivered:
-
12 carries
-
49 rushing yards
-
2 rushing touchdowns
Those two touchdowns weren’t just statistics — they were momentum drivers. Seattle trusted the run in red-zone situations, and it paid off.
Houston’s Ground Struggles
Houston never found consistency on early downs. Limited run support meant:
-
More third-and-long scenarios
-
Increased defensive pressure
-
Greater risk in passing situations
The Texans vs Seahawks match player stats clearly highlight this imbalance as a key factor in the outcome.
Receiving Leaders: A Breakout Performance
Jaxon Smith-Njigba Shines
Jaxon Smith-Njigba was electric:
-
8 receptions
-
123 receiving yards
-
1 touchdown
This marked another 100+ yard performance in his growing NFL résumé. His route precision and yards-after-catch ability made the difference.
Despite equal passing yardage totals between teams, Smith-Njigba’s explosiveness created high-impact moments that Houston couldn’t match.
Defensive Highlights: Momentum Shifts
Defense played a pivotal role on both sides.
Will Anderson Jr.’s Game-Changing Play
Will Anderson Jr. stood out for Houston:
-
1 sack
-
1 forced fumble
-
1 fumble recovery returned for touchdown
-
5 total tackles
His defensive touchdown kept Houston within striking distance and energized the sideline.
Even in defeat, Anderson delivered one of the game’s most impactful performances.
Seattle’s Defensive Pressure
Seattle’s defense contributed through:
-
Multiple quarterback pressures
-
Key third-down stops
-
Timely turnovers
The Texans vs Seahawks match player stats show that while total yardage was competitive, defensive discipline tilted in Seattle’s favor during critical moments.
Key Game-Changing Moments
Several pivotal sequences shaped the outcome:
1. Charbonnet’s First Red-Zone Score
A physical touchdown run that established early dominance.
2. Smith-Njigba’s Explosive Touchdown
A momentum-shifting deep connection that energized Seattle.
3. Anderson Jr.’s Defensive TD
Houston’s biggest spark and turning point opportunity.
4. Seattle’s Third-Down Stops
Repeated defensive holds halted Houston comeback attempts.
5. Final Clock-Control Drive
Seattle closed the game efficiently, limiting Houston’s final opportunities.
Each of these moments aligns clearly with the broader Texans vs Seahawks match player stats narrative.
What the Stats Reveal About Each Team
Seattle Seahawks: Balanced & Composed
Seattle demonstrated:
-
Effective rushing attack
-
Efficient situational passing
-
Strong defensive pressure
-
Ball security
-
Superior possession control
The balance across offensive phases is what separated them.
Houston Texans: Talent with Imbalance
Houston showed:
-
Explosive defensive playmaking
-
Promising quarterback leadership
-
Strong intermediate passing routes
However:
-
Lack of rushing production
-
Pass protection issues
-
Lower yards per play
These limitations prevented sustained offensive rhythm.
Strategic Takeaways Moving Forward
For Seattle
If Seattle continues combining:
-
Balanced run-pass schemes
-
Controlled tempo
-
Defensive pressure
They position themselves as a strong postseason contender.
For Houston
Houston’s focus moving forward should be:
-
Improving offensive line protection
-
Establishing a reliable ground game
-
Reducing predictable passing scenarios
With Stroud’s talent and Anderson’s defensive upside, the foundation is strong — but balance must improve.
Final Thoughts
The Texans vs Seahawks match player stats reveal a game far more nuanced than a simple 27–19 final score.
While Houston demonstrated flashes of brilliance — particularly on defense — Seattle’s balanced attack, red-zone efficiency, and situational discipline ultimately secured the win.
Numbers tell stories. And in this matchup, the story was about balance, efficiency, and execution under pressure.
Frequently Asked Questions
1. What was the biggest statistical difference?
Rushing yards and yards per play heavily favored Seattle.
2. Who was the standout offensive player?
Jaxon Smith-Njigba with 123 yards and a touchdown.
3. How did C.J. Stroud perform?
C. J. Stroud showed resilience but faced heavy pressure and limited run support.
4. Which defensive player had the biggest impact?
Will Anderson Jr. with a sack, forced fumble, and touchdown recovery.
5. What ultimately decided the game?
Seattle’s rushing efficiency, time of possession advantage, and critical third-down stops.

Application Mobile DualMedia Article: A Complete Guide to the DualMedia Mobile Experience

On! vs LOOP: How to Tell the Difference

Text to Music AI: How Artificial Intelligence Is Changing the Way We Create Songs

Who Is Amelia Jane Henson? Everything You Need to Know About Mia Sara and Brian Henson’s Daughter

Who Is Nadia Farmiga? Everything You Need to Know About Vera Farmiga’s Sister

Who Is Jasmine Gong? Everything You Should Know About Brad Williams’ Wife
-
 CELEBRITY1 year ago
Who Is Amelia Jane Henson? Everything You Need to Know About Mia Sara and Brian Henson’s Daughter
-
 BUSINESS1 year ago
Who Is Nadia Farmiga? Everything You Need to Know About Vera Farmiga’s Sister
-
 CELEBRITY1 year ago
Who Is Jasmine Gong? Everything You Should Know About Brad Williams’ Wife
-

 CELEBRITY1 year ago
Matt Danzeisen: The Influential Yet Low-Key Force Behind Peter Thiel’s Success
-

 CELEBRITY1 year ago
Rachel Catudal: Everything You Need to Know About Brandon Quinn’s Wife
-

 CELEBRITY1 year ago
Who Is Gianluca Cugnetto? Everything You Need to Know About Hannah Waddingham’s Ex-Husband
-

 CELEBRITY1 year ago
Who Is Rosemary Margaret Hobor?: Everything You Need to Know About John Candy’s Wife
-

 CELEBRITY1 year ago
Who Is Joe Alfie Winslet Mendes? Everything You Should Know About Kate Winslet’s Son